Many applications work with graphics; applications with graphical user interfaces can’t escape them. We’ll look at several models for graphics, and in later articles explore how to test them.
Graphics are a powerful way to support human-computer interaction, but they are a challenge to test.
This series of articles is a continued exploration of creating test oracles. We’ll look at models for graphics, some ways to sidestep the challenge of automated testing, and some ways to face and overcome those challenges.
It’s easy to think of graphics as a monolith, but there are various approaches, through a mix of hardware, operating system, and libraries.
The Memory-Mapped Pixel Model
We’ll start with the memory-mapped pixel model.
This model was common in early home computers. The heart of the approach is that an array of memory maps to the pixels in rows and columns on a screen. Most computers have a variety of “display modes” that determine the exact mapping.
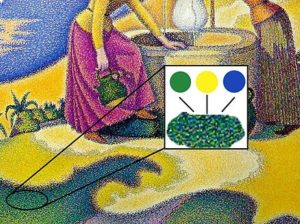
For example, one mode uses one bit per pixel to create a black and white image. Another uses 4 bits, each selecting one of 16 colors. Another mode has a color table of 256 slots, each holding a 16- or 32-bit RGB (red-green-blue) value; each byte in the display memory maps to one of those slots. (You can even change the table on the fly, creating even more possibilities.)
Nowadays, personal computers typically have graphic cards that manage this part of display, but you still may think about the pixel model when you’re working with photos.
Choosing an Oracle
Even this simple model reveals challenges in creating oracles.
The first question is where to look.
In some sense, the most accurate place to look is the display itself. If the goal is to get parts of the screen to light up in a certain way, we can’t really know that’s happening unless we check it.
While we can imagine a camera rig of some sort in front of the screen, this check usually takes the form “Human looks at display.”
In the words of Yogi Berra, “You can observe a lot just by watching.” But humans aren’t infinitely attentive nor accurate enough for extended checking.
Instead, we could check that the expected pixels are shown, using a library that decodes the memory and display mode to tell us what color is at a given coordinate.
Or, we could work at the memory level: does each byte contain what we expect?
Or, we could work at the application level: are its data structures what we expect?
Notice the shift we’re making as we move from the screen up to the application: we’ve gone from checking that the application does the right thing to asking whether its structures are what we expect. Somewhere along the way, we may lose confidence that we know whether the graphics are right.
All models have tradeoffs: they all have choices about where to look. We must balance the tradeoffs in a way that gives us enough confidence that things are working.
The Vector Model
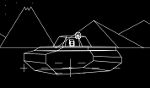
You can generalize from a point to a line, and there are a few systems that take that approach. These systems are good at drawing clear, sharp lines, but struggle to draw shading or photos. If you’ve ever seen the old Battlezone or Tempest video games, you’ve seen a vector-based system.
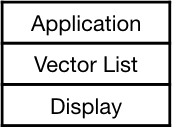
A vector is typically represented as two points and possibly a color.
The display system walks through the list, drawing each specified line segment.
The issues for testing are similar to those for pixel systems.
The Polygon (Path) Model
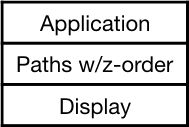
We can generalize from point to vector to polygon, though “path” is a more common term. A path can be stroked (its outline drawn) and/or filled with a color.
Paths have a z-order; each is assigned to a particular depth. This allows them to be drawn back to front (“painter’s algorithm”) to get a 2-1/2d effect.
In some systems, paths are defined by polygons (an ordered list of “corner” points in order). In other systems, paths can be curved (e.g., a Bezier curve). it’s common to have a whole set of transformations available such as rotation, translation, and skew.
Compound Models
You can have a compound model. MacOS graphics use the “Quartz” model that allows three types of graphics:
- Paths
- Images (e.g., photos)
- Text
These can be combined to generate sophisticated views. For example, you can map a picture and text onto a shape, then map that onto a transformed polygon.
Display is a three-part process:
1. Draw the path (etc.) in a user display space
2. Map it to the coordinates of the device (or PDF) to be displayed
3. Rasterize it, i.e., convert it to pixels to display
While the compound model allows interesting effects, it doesn’t change the conceptual view that there are various levels at which you can explore what happened, and you still have to decide where to test.
To 3D and Beyond
We needn’t stop at a two-dimensional view; we can consider the problem of 3-dimensional systems as well. Windows (Direct 3-D and others) and Mac (Metal) both support 3D views. They typically interact with two-dimensional views as well.
At some level, this doesn’t change the testing issues either – the view is mapped to a screen, and there are various places where you can test.
The techniques I’ll describe in future articles aren’t focused on 3-D per se; there may well be other techniques particularly suited for 3-D.
A Default Model
I have a working model I use as my default. It fits well for typical applications that have GUI widgets and custom shapes. I only use more sophisticated models when this doesn’t fit.
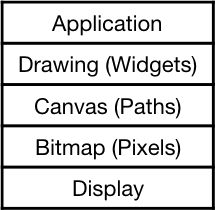
You can test starting from any stage of this picture: for a spreadsheet you to focus on widgets at the drawing level; for a photo editor, the bitmap level might be more appropriate.
What’s Next?
We’ve seen several models for graphic systems. Next we’ll look at ways to test them.
Other Articles in This Series
- “Display: Testing Graphics, Part 2“
- “Screen-Based Tests: Testing Graphics, Part 3“
- “Internal Objects: Testing Graphics, Part 4“