How do you track user stories? Does it help your team work better?
We’ll compare multiple different approaches.
Why Track?
Why do we want to track user stories? There are several reasons, some better than others. We want to:
- understand the state of items: what’s done, in progress, or yet to do
- know if we’re “on track” to hit deadlines or commitments
- use our rate of development to make predictions about what will be done when
- understand the evolving “shape” of our product – what it can and can’t do
- keep track of who’s doing what
- select an “appropriate” amount of work per sprint/iteration
- help people coordinate their work
- drive a sense of urgency or fear
- build alignment
- help make tradeoffs
Which ones apply to you? Does your tracking method support them?
Flat List

One approach is to have a flat list of stories, perhaps divided into sprints or iterations. Many planning tools support this approach. Some tools let you sort the items in various ways.
In principle, this approach could handle any size; I’ve seen it used (though perhaps not used well) for hundreds of stories.
Outline View

An outline view arranges stories hierarchically, e.g., with themes or areas at the top level, containing epics, which contain stories, which may contain smaller stories. (These may go on to include tasks – activities rather than capabilities.)
Some planning tools support this view, and I’ve seen it done with documents or spreadsheets as well.
Kanban Board
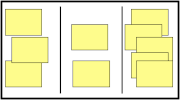
A kanban board is organized into columns and possibly rows, with stories in the cells. Each column represents a different state (and possibly a different group working on it). Rows (if used) may identify different classes of stories, or stories subject to different policies (e.g., “expedite”)
The word “Kanban” is overloaded. Originally, kanban was an approach at Toyota using bins and cards to create a “pull” method for inventory management. A “true” kanban board simulates this by having work-in-progress (WIP) limits, allowing a limited number of slots per column. A “pseudo” kanban doesn’t impose or imply WIP limits.
(“True” and “pseudo” are my words; nobody I know “officially” calls them that.)
WIP limits and policies help to keep the delivery system stable, and to reduce the time it takes to deliver things.
The smallest boards I’ve used had three columns: “To do”, “Doing”, and “Done”. Five to ten columns are not uncommon, and multi-team organizations may have boards feeding from one team to another.
Story Solitaire
In Extreme Programming (XP), especially early on, user stories were written on index cards. Given a stack of these, the customer (product owner) can play “solitaire” – dealing out the cards into various layouts. They might arrange the cards by value, by cost, by expected iteration, by product area, etc.
Doing this physically lets you work quickly, and encourages you to explore alternatives (as you re-construct it every time you change the layout). It makes for easy collaboration when you’re collocated and the team is small enough to stand around a table.
This approach has a limit of 50 to maybe 100 cards – whatever you can conveniently spread out on a table:)
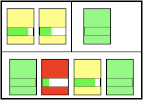
Headline + Details
One way to frame a story is as a “headline” – the title of the story – plus “details” – information about the story, possibly in the form of sub-stories. (See the Industrial XP article on “Planning Game”.) In card form, the headline is written on a file card, and the details are written on a sticky note and attached. To manage this, you lay out the cards in any way you want, perhaps taped to a poster or wall.
By keeping the headline at the level of high-level features or capabilities, a moderate number of cards can capture a release (say 5-20 cards). With this few, the layout is not critical.
The details are on a sticky note so they can be changed as you learn more (either about the story or about how well you can fulfill it). (This is a way to manage “scalable” stories.)
I’ve seen and used an electronic variant of this in spreadsheets – the column describes the main title / capability, and the rows beneath hold sub-stories and extensions. Sometimes the columns are divided into zones such as “MOSCOW” – “Must have / Should have / Could have / Won’t have” or letter grades.
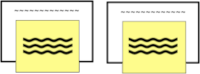
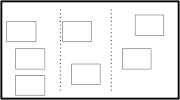
Parking Lot Chart
(AKA Feature Set Progress Report) This report divides the page into sections representing high-level areas (themes). Inside, blocks represent capabilities, and show a status. Each contains a progress bar representing what % of features for that capability are completed.
This is from Feature-Driven Development (FDD). In FDD, a “feature” is a small, nearly uniform-sized story. I haven’t worked with an FDD team, but I’ve seen a couple teams that use this diagram.
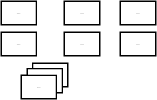
Story Map
A story map is a rectangular arrangement of stories. Horizontally, they are ordered by when the story is used (by the user:) in a typical interaction. Vertically, the stories are ordered by importance (most important on top). Cards aligned beneath a card are typical alternatives and variations. It’s common to group the columns into themes or areas.
The highest cards identify the most critical features that should be in an early release. The horizontal arrangement helps you ensure you’re delivering a full end-to-end capability.
Combinations
If it’s helpful, nothing stops you from using a combination of tracking approaches. (Many tools provide two or more methods.)
Some common ones:
- List + Outline
- Outline + Feature Set Report
- List + Kanban
It’s clear that it’s hard to integrate both a product and delivery view. (The Parking Lot Chart probably does best at that.) Beyond that, most tools I’ve seen do not do particularly well at supporting multiple collaborating teams.
Assessing Tools: Encourage Valuable Stories
There’s a huge temptation to create “stories” that only partially implement a feature. (Some call these “technical stories”, where “technical” is a way of saying “non-“.)
This is especially common when multiple teams must collaborate to deliver capabilities. Even within a team, there’s a temptation to treat tasks as stories, and implement by layer – database, API, user interface, integration.
Splits by layer don’t make sense from a capability or feature perspective. There’s a saying, “People don’t want drills, they want holes.” The same sentiment applies: “People don’t want databases, they want capabilities.”
Partial stories make it hard for a customer or product owner to effectively guide development. Instead of choosing features they want, they have to figure out if a “story” is the last piece of a puzzle, unlocking a capability.
How well does each approach push a team toward creating stories that are valuable (end-to-end) to a customer?
| Little | Some | Lots |
| Flat List Kanban | Outline Story Solitaire | Story Map Header + Details Parking Lot Chart |
- A flat list doesn’t particularly care what it’s a list of.
- Kanban doesn’t really care whether it manages stories, tasks, or whatever.
- An outline is often naturally organized by levels or scope of stories, but can also be used to organize tasks.
- Story solitaire exerts some pressure to have true stories – it will be apparent when a customer doesn’t understand the “stories”.
- Story maps explicitly organize capabilities from a user and product point of view.
- Header + Details and Parking Lot Charts both call for a particular type of (valuable) story.
Assessing Tools: Provide Insight into Product Structure
It can be hard to build a picture of a product’s structure. Jeff Patton points out that a list or set of small stories, with no bigger organizing principle, resembles a bag of leaves – and it’s hard to re-construct a tree from that.
| Little | Some | Lots |
| Flat List Kanban | Header + Details Outline Story Solitaire | Story Map Parking Lot Chart |
- Flat list and kanban don’t really care about their contents, and don’t contribute to understanding product structure.
- Header + Details provides a two-level hierarchy, and outline view a multi-level hierarchy; these are often divided into larger and smaller capabilities according to the product structure. Story solitaire can “play” with product structure but doesn’t enforce it.
- Story maps and parking lot charts are intentionally designed to support understanding of a product’s areas and structure.
Assessing Tools: Push Toward Small Releases
Some approaches organize many, many stories, and encourage releases to grow and grow. Other approaches become unwieldy at large scale, and thus help restrict the size of a release.
| Little | Some | Lots |
| Flat List Outline | Parking Lot Chart | Kanban Story Solitaire Header + Details Story Map |
- Flat list and outline (particularly when supported by electronic tools) have a tendency to grow unchecked; there’s no “weight” to a large set of stories.
- A parking lot chart can support small releases, but as a summary view, it can also support hundreds of features, hidden in the graphs.
- The others, especially in their physical mode, push toward smaller releases. Physical forms get unwieldy at larger sizes, so you feel the pain. In tools, their focus on two-dimensional organization makes them noticeably harder to use when they have too many stories.
Pushing toward small release may sound limiting, but small releases help you get faster feedback, and can improve your economics.
Concluding Remarks
As you ponder tracking, consider how you use user stories. Are they tools that benefit the whole team? Are they markers for conversations, rather than specs? Do they each provide a capability on their own? Are you able to scale stories, enabling evolutionary design?
Detailed tracking of many stories is a red flag to me. So many times when I’ve seen this, the team is too internally focused, releasing very slowly and not in a tight feedback loop with users and customers.
Looking over the alternatives we discussed, I can’t help but observe that a flat list (even organized by priority:) provides weak support for keeping track of stories and understanding the product. If you’re only using that, consider trying out some of the alternatives.
Be careful with the tools you use – are they really enhancing your teamwork? Just about every coach I’ve known has told me they prefer physical tools when it’s possible. (Admittedly, it isn’t always possible, especially in the days of forced-remote teams.)
In any case, review how tracking supports what you do. Is it making you more agile? Can you improve it?
Resources
A Practical Guide to Feature-Driven Development, by Stephen R. Palmer and John M. Felsing. 2002.
Extreme Programming Explored 2/e, by Kent Beck with Cynthia Andres. 2005.
“Planning Game”, http://industrialxp.org/planningGame.html – retrieved 2021-01-05.
“Small – Scalable – Stories in the INVEST Model”, by Bill Wake. https://xp123.com/articles/small-scalable-stories-in-the-invest-model/
User Story Mapping, by Jeff Patton. 2014.