| Charts can help a team see itself better. |
This is an exercise for coaches, used in the course Coaching Agile Software Teams at XP Agile Universe ’04, taught by Ron Jeffries and Bill Wake.
We ran the exercise using Thiagi’s ENVELOPES framegame. This format has envelopes with problems on them, and running several rounds where teams try to come up with a solution to the problem. Finally, a team compares the solutions and chooses the one that best exemplifies the answer.
In this online version, we’ll use a different approach. We’ll show each graph, and you can write down your impression of what it’s telling you. Finally, you can compare your answer to expert answers.
The Graphs
| 1. Velocity
|
||||||||||||||||||||||||||||||
|
2. Lines of Code Address two cases:
|
||||||||||||||||||||||||||||||
|
3. Velocity
|
||||||||||||||||||||||||||||||
|
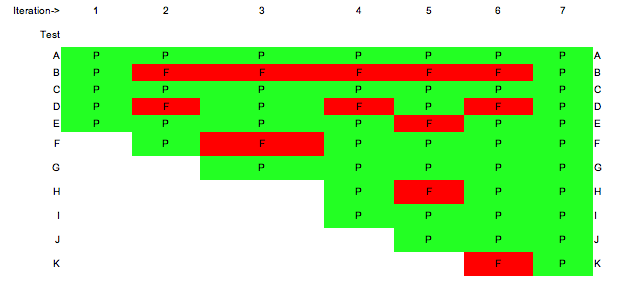
4. Acceptance Tests
|
||||||||||||||||||||||||||||||
|
5. Checkins
|
||||||||||||||||||||||||||||||
|
6. Tasks This snapshot was taken Wednesday, halfway through the iteration.
|
||||||||||||||||||||||||||||||
| 7. Acceptance Tests
|
||||||||||||||||||||||||||||||
|
8. When can we ship?
|
||||||||||||||||||||||||||||||
.gif)
Expert Answers
Visit the answer page.
Further Study
Several of the XP books (Explained, Installed, Explored, and others) have examples of Big Visible Charts. In Agile Software Development, Alistair Cockburn frames them as information radiators. View (and contribute to!) the room and chart gallery for more examples.
Resources and Related Articles
- Extreme Programming Explained: Embrace Change, by Kent Beck.
- Extreme Programming Installed, by Ron Jeffries et al.
- Extreme Programming Explored, by Bill Wake.
- Agile Software Development, by Alistair Cockburn.
[Written September, 2004.]