This page has answers for the coaching charts exercise developed by Ron Jeffries and Bill Wake.
Don’t peek at this page unless you want to see answers.
The Graphs
| 1. Velocity
This is a very artificial-looking velocity curve. It’s hard to believe this is happening randomly; there must be something going on. Here are some possibilities; most are bad news.
|
||||||||||||||||||||||||||||||
| 2. Lines of Code
Address two cases:  Case 1: Velocity is about the same each iteration. That they’re sustaining their velocity even when deleting code is a good sign. Case 2: Velocity tracks LOC. |
||||||||||||||||||||||||||||||
| 3. Velocity
The team appears to be generally improving, though there is a lot of fluctuation. Will the velocity keep trending upward? |
||||||||||||||||||||||||||||||
| 4. Acceptance Tests
The most noticeable thing about this chart is its opacity: it doesn’t present it’s data in an interesting way. See the later acceptance tests chart for the same data presented better (and discussion of the data itself). |
||||||||||||||||||||||||||||||
5. Checkins
It’s clear that Tuesdays are the day when the least is getting checked in, and Wednesday seems to try to catch up a little. Is the planning meeting (or something else) on Tuesdays? The team is otherwise fairly consistent from day to day and week to week. How many people are checking in? If it’s two or three pairs, then each is checking in 3 or 4 times a day. The pattern is clear; does the chart still help the team? |
||||||||||||||||||||||||||||||
| 6. Tasks
This snapshot was taken Wednesday, halfway through the iteration.
The team is done with half of the tasks, but none of the stories. Are they cooperating well, or do we have one developer per story? It’s hard to tell if the iteration is in jeopardy – if stories aren’t completing for the same reason, we may have a real problem. The team is treating all stories as equal priority. I’d definitely push the team to focus on getting the most important story completed first. |
||||||||||||||||||||||||||||||
7. Acceptance Tests
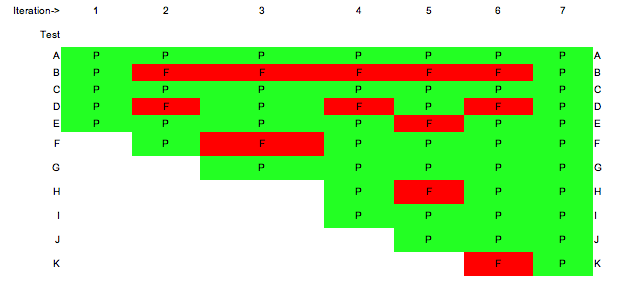 This is the earlier acceptance test data, recorded in a more understandable form. Overall, we see that this is not a team that keeps tests passing once they’ve passed the first time. (I prefer the ratchet approach: once it passes, it’s kept green.) Note that the team is adding tests each iteration, but not very many. Only the first and last iteration had all tests green. What will the next iteration be like? (Did someone just declare victory on the tests, or are they really all working right?) Test B is clearly a problem: it’s never passing. Why not? Why hasn’t the team addressed this problem? Test D is also interesting: it’s passing on alternate runs. Sometimes this indicates that a test isn’t properly cleaning up after itself. Or it may be a symptom of other fragility: we fix the problem, but then the next change breaks it again. In any case, the team needs to work on this test too. Are these tests being run only once per iteration? Maybe more frequent reporting would help the team keep them green. |
||||||||||||||||||||||||||||||
| 8. When can we ship?
The trend line is in a good direction: down. It looks like the team will be shipping in about two iterations. The jig upwards at the start of each iteration represents growth in the number of points remaining, either due to re-estimates or due to added stories. But notice that this is getting smaller each iteration as well. It feels like this team is in control. |
||||||||||||||||||||||||||||||
.gif)
Thanks
Thanks to the attendees of the class Coaching Agile Software Teams for participating in this exercise.
[Written September, 2004.]